
Ennov pharmacovigilance suite
PV-Analyzer
Signal Detection Software
- Detailed analyses and graphical outputs
- Key statistical measures
- Flexible queries
- Three dimensional data cube
- Configurable alert thresholds
The Signal Detection Challenge
There is a growing emphasis on signal detection and signal management in Pharmacovigilance. Companies must be able to manage signals detected: evaluating them to understand the clinical risk in light of multiple impacting factors, in a demonstrably controlled manner.
Benefit/risk balance for a drug, vaccine, or treatment is impacted by the disease the product is intended to treat, distribution of the disease and product, clinical trial data, environmental influences, and other epidemiological factors. Signal management requires considerable workflow and rigorous process control.
A Robust Signal Detection and Safety Data Analysis Solution
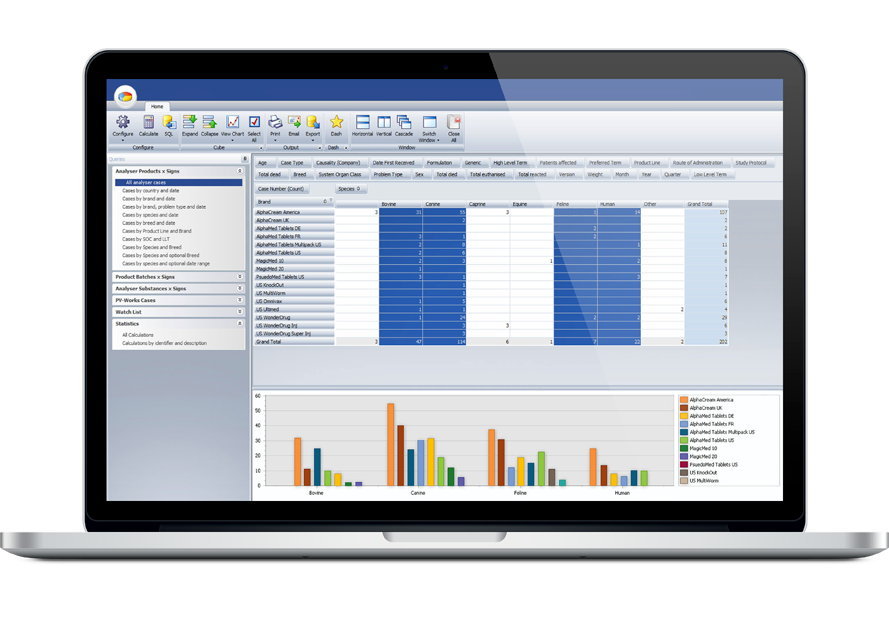
Your pharmacovigilance database contains a wealth of important information about your products. The extensive data mining and reporting capabilities of PV-Analyzer brings this knowledge to your fingertips allowing you to prepare detailed analyses and graphical outputs for both internal and external use.
With PV-Analyzer you can rapidly calculate key statistical measures that are widely used by regulatory authorities such as PRR, ROR, and MGPS and apply smart stratification to examine the database and detect where configurable thresholds have been exceeded. PV-Analyzer provides data mining capabilities that allow you to run flexible queries and return the results in a grid that cab be sorted, filtered, grouped, printed and exported. A three dimensional data cube allows users to slice and dice data on the fly, comparing and subsetting data as needed. Standard mathematical functions such as count, sum, average, max / min and standard deviation can be applied to the data sets as well.
The application integrates easily with PV-Works, other PV software and various external data sources to increase flexibility in preparing such important metrics.
Signal Management
Regulatory Authorities around the world are increasingly looking for Marketing Authorisation holders to be able to demonstrate a methodical and controlled process of signal management.
PV-Analyzer can be readily interfaced with Ennov Process to provide a comprehensive and robust solution. Potential signals can be captured, reviewed, evaluated, and assessed using flexible data forms and configurable workflows. The Ennov tools allow you to adopt a holistic and efficient approach to signal detection and management, and ultimately help you to promote product safety.
Advanced Statistical Analyses and Graphical Reporting
PV-Analyzer provides and wide array of advanced statistical analysis capabilities to support your signal detection program including:
- Creating Frequentist statistics such as PRR, ROR, OE, Chi-Square
- Creating Bayesian statistics such as EBGM, MGPS, IC and confidence intervals
- Defining numerator and denominator source data sets
- Aggregating signals into different MedDRA / VeDDRA levels (SOC, PT)
- Grouping target products into logical subsets (generic name or product family)
- Analyzing the effects of interacting products
- Analyzing by batch number
- Stratifying case data by a variety of factors such as country, date, gender, dosage form as well as user-defined groups like age / weight ranges (or species / breed for veterinary data)
- Identifying potential signals against configurable thresholds
- Comparing results against previous calculations and see visual indication of changing trends
- Drilling down from a statistical result back to PV-Works in order to view the contributing cases
- Storing statistical results in the PV-Analyzer database for tracking review comments
PV-Analyzer also offers robust graphical presentations of all base data and derived results. All grid and cube results can be printed or exported to Microsoft Excel for further analysis and formatting. An advanced report writing tool supports the ad-hoc development of other required output formats.
Core Capabilities
- Three dimensional data cube
- Frequentist and Bayesian statistics
- Configurable numerator and denominator data sets
- Configurable data set stratification
- Flexible ad-hoc query tool
- Extensive graphical presentation options
- Advanced report writing tool
- Configurable alert thresholds
- Direct export to Microsoft Excel
Key Features
- Explore and manipulate data with drag and drop interface
- Apply customized stratification to produce comparable statistics
- Identify potential signals against configurable thresholds
- See changing trends when comparing previous calculations
- Store statistical results and track signal review
- Define configuration groups using almost any parameter
- Standardize the names of concomitant medications
- Define expected clinical signs by product and subset statistical results into labelled and un-labelled groups